Design Your Solar Roof
Here’s a 4 hour class on solar design, which compliments the Material Selection class. A partial transcript is provided here along with the course videos. Advanced students can skip the lecture on go straight to the design examples before moving onto the next class.
Content not permitted for distribution without written consent. Please inform the instructor if you have seen this content distributed elsewhere. Partial transcript below.
Performance Estimation

Let’s perform a Pvwatts example to determine how much energy a solar array will produce. PVWatts is a free online resource published by the Department of Energy through National Renewable Energy Labs. The same data used by PVWatts is also used by commercial design software for energy modeling and so PV Watts will provide substantial data about the project site under a close look.

Despite its basic appearance, PV Watts makes it easy to estimate how much electricity an unshaded solar array will produce. The calculation is made for for every hour of the day, every day of the year based on local weather data.

Go to the PVWatts website and put your address and system size to get started. I recommend performing a PV Watts example using a 1 kilowatt solar array to keep things simple.

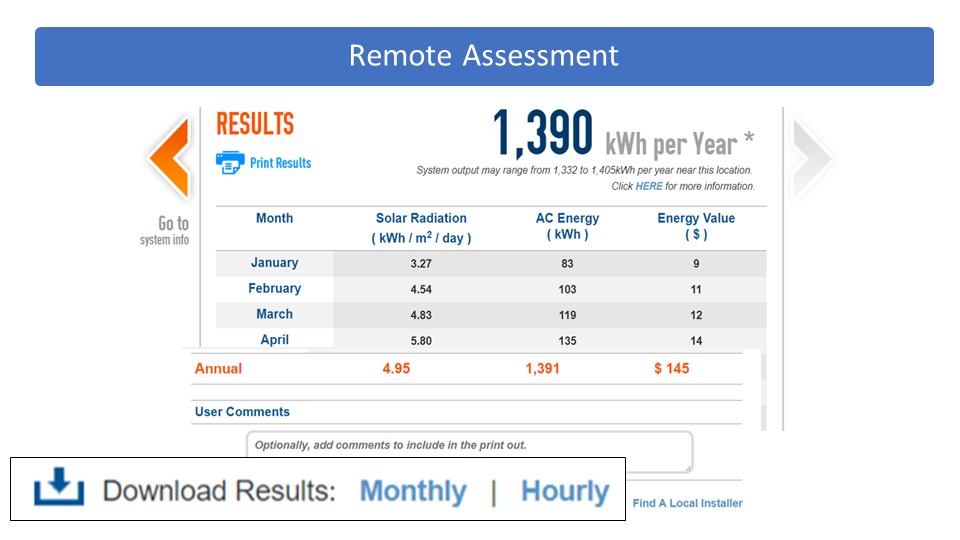
A 1 kilowatt solar array in Houston, TX facing due south at a 20 degree roof tilt angle will produce about 1400 kilowatt hours of energy per year. Summer months produce more than winter, because the days are longer.

Close examination of the input data will reveal supporting information. The roof tilt button reveals common angles the solar array will be tilted at. This is a useful resource for converting common roof tilt jargon such as 4:12 or 5:12 into actual angles.
In addition to tilt, the compass orientation the array faces is modeled, called azimuth. A 180 degree azimuth is another way to say due south. Likewise a 90 degree azimuth is due east and a 270 degree azimuth is due west.
All this can be modeled in PV Watts, so the next step is to run an experiment. How does tilt angle and orientation impact solar performance? The answer is not as much as you might think, especially at shallow tilt angles.

A due west facing array on a 5:12 roof pitch will only produce 11 percent less than a south facing array at the same tilt angle. At a steeper tilt, such as a 45 degree 12:12 roof pitch, the performance difference is much greater, about a 20% difference.
Latitude also plays a minor role, moving north from Houston to Indianapolis increases these differences by a couple percent. Even so, performance differences of 25% are not that extreme for being able to land the panels flexibly on a jobsite. Yes, there is an ideal tilt angle for solar, but by and large solar design simply conforms to the existing roof, and there is much greater flexibility in facing the panels east, or west, or at shallower tilts. Solar design is more pragmatic than theoretical.

Solar panels can be bolted 90 degrees down the side of a building, and still be cost-effective in the right location, such as in New York City where electricity is over 3x the national average in cost, and rooftop space is already limited due to the tall, skinny nature of its buildings. Having the modules tilted at 90 degrees is also found in off-grid power stations in Canada, to avoid snowfall. And there are other instances too, where it can be more cost effective to think pragmatically about the design rather than constrain yourself to solar theory, which would want all solar to be south-facing, with its tilt angle at the line of latitude. Instead, solar designers typically follow the roof.
In other words, tilting the array up off an already slanted roof rarely makes sense. A steeper angle will increase solar production, but not by much and it also increase the installation cost while shrinking the usable roof area, because of the shadows cast from the array itself. Increased wind load increases structural concerns.
And so, it can be assumed most rooftop solar will be installed at the roof tilt angle and orientation, and that the performance will not vary by more than a couple percentage points ranging from southeast to southwest, with a little more loss if the array faces all the way due east or due west.

Therefore, using PVWatts to determine that one kilowatt of rooftop solar will produce roughly 1400 kilowatt hours per year in a given area, that number can serve as a scalar for quick, off the cuff energy estimates. For example, if 1 watt of solar will produce 1.4 kilowatt hours per year, a 5 kW array will produce 7,000 kwh annually. If the array faced east or west, that performance is about 10% less. If a home uses 11,000 kwh annually, divide by 1.4 and the home needs approximately an 8kW array to fully offset its energy use (assuming the utility provides retail-priced credit for the energy produced).
Please experiment with PVWatts in your own time – it is a necessary first step in designing any kind of solar. But for now, let’s take a close look at the very end of the PV Watts calculation. On the same page that displays the monthly and annual production data, an option is presented to download the performance data on an hourly basis.
This is where detailed site information used for the PVWatts calculation is revealed, such as the amount of sunlight in the air and on the solar panel itself, as well as roof temperature, ambient temperature, wind speed, and more. All of these factors produce an estimate that accounts for both sunny and cloudy days, hourly performance differences as the sun moves across the sky throughout the day, performance losses due to temperature, as well as additional assumed losses due to dust, system age, voltage drop, equipment inefficiencies, and even some downtime for system maintenance.

Getting back to the hourly data, this spreadsheet is very useful for building a site energy model. I start here, adding in customer load information, for estimating off-grid battery bank capacity requirements or modeling commercial building demand. Subtracting customer load information will better quantify the system economics, particularly in instances where the utility buyback rate for solar is not the same as the cost of electricity from the utility. Calculating solar payback is another essential industry skill, and understanding the effective generation rate of the array (the value of the electricity produced) is necessary to calculate simple payback, or how many years it will take for project expenses to be recovered.

The two major items PVWatts does not account for is shade or snow. For shade modeling, the best is to use commercial 3D modeling software – of which there is a variety that we will get into later. Unshaded solar arrays can skip this step. There are also manual tools that can be used, which I don’t normally recommend as using software is as accurate and doesn’t require a site visit.
Snow, on the other hand, might require discounting weeks of lost production in the winter, depending on the area. Fortunately, winter days are short, so even losing a few weeks in December might only account for 5% of annual production. This is more of a concern for off-gridders – on a commercial project where building load is pushed to the limit, it might even be beneficial to keep the snow on the modules while it melts, rather than have it mound in one place.
The point I’m trying to make is that if you live in an area that has snow sitting on top of the roof for weeks out of the year, the PVWatts production numbers need to be reduced. For casual snow such as is found in most of the country, the default PVWatts discount assumptions are good enough for a reasonable estimate – annual variances in weather such as hurricanes or droughts will have a greater impact than modest snowfall on the array.
The Big Payback

Let’s assume a 10 year simple payback is desired by the project. What should the budget be to achieve this goal? Determining the real time value of electricity is complicated. One role of a state public utility commission is to make sure electric bills are simple enough for customers to understand. Many states have net-metering policies which require the utility to purchase solar electricity from the customer at the same price for which utility charges the customer for regular grid electricity.
That net-metering policy makes solar economics simple. If the electric rate is 10 cents per kilowatt hour, the effective generation rate of the array is 10 cents per kilowatt hour. If 1 watt of solar produces 1.4 kilowatt hours per year, then 1 watt of solar produces 14 “cents per watt” per year. A product needing a 10 year payback would need an installation budget of $1.40 “dollars per watt”. Common to the United States is a federal tax credit for solar, which changes with time. Right now the tax credit is 26%, and so the final solar budget required for a 10 year payback with a “net metered” system for most of the United States is about $2/W.

According to 2019 solar installation pricing provided by EnergySage, the average solar installation pricing is closer to $3 per watt (although it continues to drop). At $3/W, applying the 30% tax credit, for an array that produces 1.4 kwh per watt per year, at an effective generation rate of $0.10 per kwh, the project achieves a 15 year payback.

So the production value found in PV Watts can be combined with local electricity pricing to determine how solar payback. That production value does vary throughout the country, but again, not as much as you might think. In Reno, NV one watt of solar produces 1.6 kwh/year whereas in Buffalo, NY, the same watt of solar produces closer to 1.2 kwh/year – a 25% percent decrease.

But the price of electricity changes as well. Not only does that net-metering policy dramatically change across the country, the actual price of electricity changes as well. Unlike gas, direct electricity pricing and policy has traditionally has been left to the states to govern. For the time being, net-metering is a right that is mandated by the public utility commissions or voluntarily offered by electric providers.

But if our goal is to drive solar growth in the most cost-effective manner possible, while letting the powers that be make the rules, then a solar designer must understand that it is the price of electricity that is the primary driver of the market. The price of electricity across the country varies to a greater extent than the amount of sunlight in the air on a given day. The sun rises and falls and shines on all of the United States. But New York City pays three times more for its electricity than in Houston. Even if the Texas sunlight is better than the northeast USA, even if installation costs are cheaper and projects are bigger, it is that high priced electricity that is the driver of the market – more so than system production.
Because of that sky high electricity cost, despite the cloudier weather, New York solar projects are more economic and have a larger market than Texas. Northeast USA installs twice as much rooftop solar as the south.

Let’s take a look at budget. Including the import tariffs, in dark blue is the cost of the solar panel itself, hovering between 40 cents per watt up to 60 cents per watt. The panel hard cost is about the same whether or not it’s a residential, commercial, or utility scale. Any panel the markup is in distributor profit, which appears up here in gray. We will revisit this soft cost in a minute, as competitive material bidding is a good way to reduce small project cost.
The electrical balance of system budget I don’t recommend getting too cheap on. There’s some nice specialty items that can be added to a solar system that might not be code mandated, but improve the quality of the system beyond the actual solar panel or inverter itself. For example, there are a variety of ways to get the cables from the array to the point of interconnection, the conduit, cable, and electrical box planning can improve the system quality beyond the basic system itself. Many solar owners are surprised to learn that solar without batteries cannot provide power during a blackout, even during the day. Even when adding a battery, the system may not supply the whole house – and if it does the additional balance of system material gets even more complicated. These are topics covered in more advanced classes, but owners who want their systems looking clean and polished should not cheap out on balance of system material budgeting.
To calculate payback on a system installed at this budget, divide by the annual production and by the value of that production, in order to get simple payback. And remember from Pvwatts that one watt of solar will produce between 1.3 and 1.5 kilowatt hours per year in most of the United States.

Then to identify local net metering policy, visit DSIREUSA.org, a website that catalogs green energy incentives and policies at the local state and federal level. While visiting the website, check for any state sales tax exemptions – about 20% of states have them. And then let’s get back to using DSIRE to identify any state mandated net-metering policy. The next step is to contact the utility to confirm the net metering policy – not all power suppliers are required to abide by state net-metering laws.

When looking at an electric bill, even with simple net-metering it is necessary to back out any fixed charges from the bill before determining the effective generation rate of the solar array. At one end, a fully net-metered system with low fixed fees could generate at full retail value. But if the without a net-metering policy, 2/3rds or more of the solar production might have a much lower buyback value. The federal PURPA mandate is set at avoided cost – lower than $0.03/kwh in some cases.

The more complicated the rate structure becomes, the more important computer modeling and onsite batteries become. These are advanced topics that warrant their own classes. For now, let’s assume we know the effective generation rate of the solar array. Our knowledge of budgets and solar production values now allows us to calculate simple payback, measured in years.
[This is the ~20 minute mark of a 4 hour program, register for full access]